When Are The Metals Going To Out-Perform?
In this commentary I am not looking at the platinum group metals or even silver for that matter, although it has to be said the performances and future prospects for these metals from a price appreciation stance moving forward are nothing short of extremely compelling indeed. What I intend to look at in this commentary is gold and what are the underlying currents supporting the demand and future price of gold, and of course precious metals.
Present backdrop
Over the last couple of months commentary fervently released by the financial media and also personally listening to investors and various investment managers, one might jump to the conclusion that gold has lost its appeal as the all-important wealth preservation asset tool at this phase in our global macro-economic cycle, stock prices are the only game in town I am told!
Reports of stock prices reaching ever-higher levels are abound, based of stories of solid economic fundamentals coming back into play, so then why have an exposure to gold and thus the desire for investors and money managers to increase their demand for the yellow metal is apparently heavily muted.
However, taking a closer look at the real fundamentals and actual facts driving this extremely late in the business cycle appetite and price aspirations for extreme valuations in ‘risk assets’ (read stock markets here) does it not seem somewhat wide-eyed and unsuspecting by investors of actual macro reality (negative) that’s bounding our way globally?
Gold
To start with, gold is money; this has recently been re-confirmed by The Bank for International Settlements (BIS), as the Central Bank for all Central Banks being as the best definition for this financial institution. Their rules set out change behaviour at banks globally as the appropriate levels of capital and asset classes to hold as liquid core collateral of the banking system, and the current ‘Basel III’ rules recently implemented will allow gold to be re-classified as a tier one asset (zero risk) equal to cash and sovereign bonds. Gold was previously classified as a tier three asset.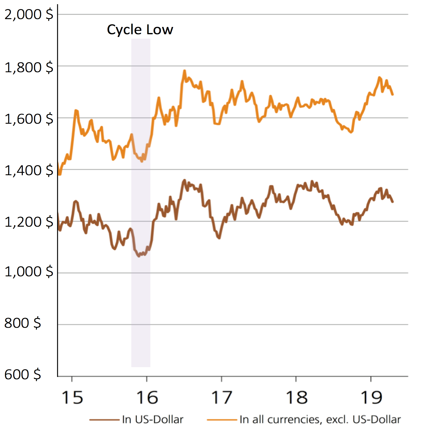
Rising Gold Price
Gold Price chart in US$ per oz
and in all other currencies excl us$
As such gold competes with the official currencies of the globe such as US$, Euro, Chinese Yuan, Japanese Yen, British Pound, etc. After the ‘big cycle correction’ of gold prices from 2011 to 2015, the price of gold has been increasing in virtually all-major currencies since the ‘major-cycle-lows’ that was flagged by our company Indigo in late 2015, with gold reaching new all-time highs in over 72 currencies in the last few months.
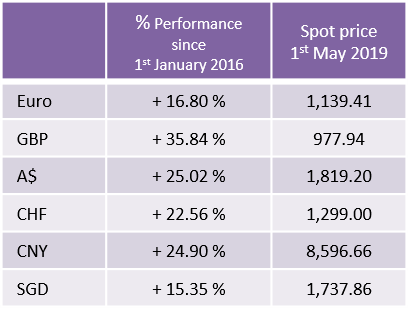
Gold Performances:
Latest “risk-on” stock market investment commentary regards the implied progressive economic fundamentals of the USA and China especially will bail out Europe and Emerging economies from crisis (Europe’s economic bloc is skating on very thin ice with no instruments left to fight the economic contraction and financial sector insolvency, alongside an enormously over-leveraged central bank).
So with that in mind lets look at China and USA to see if we really should all be in a happy place.
China
China’s impressive and beautifully-stable GDP figures are best seen as fabricated pure politics and does not reflect the real numbers or sustainability of their debt growth picture.
Xi Jinping under pressure with a Trump trade war had to beat economic GDP expectations with a crowd-pleasing ‘magic rabbit out of the hat’ in the first quarter of 2019. The number was duly produced with ample aplomb: +6.4pc.
Could this be possibly true? Of course it is not true. For example Japan’s manufacturing exports to China fell by -9.4% in March (year-on-year). Singapore’s shipments dropped by -8.7% to China, -22% from Indonesia, and -27% from Taiwan, with Korea’s exports are down -8.2%, these on the back of actual consecutive reductions already recorded.
East Asia is in the midst of an industrial recession, this realisation is unavoidable.
Domestic consumption is not leading the economy higher, with heavy slumps in property prices (although are likely to stabilise due to huge government stimulus to the benefit of undisruptive growth of debt), household demand deposits fell by -1.1% last month. This means that the growth rate of “true” M1 money is still at economic downturn levels, this clearly points towards economic stagnation into late 2019 at best.
In fact a paper last month by Wei Chen and Chang-Tai Tsieh for the Brookings Institution in which they used satellite data to track night lights in manufacturing zones, railway cargo volume, cities and ports. Entitled “A Forensic Examination of China’s National Accounts” concluded that GDP growth has been overstated by at least 1.7pc a year on average since 2006.
Bear in mind that if China’s economy is up to a fifth or even a quarter smaller than claimed (as real independent implied growth numbers would directly suggest) it implies that the total debt ratio is not 300pc of GDP (IIF data) but closer to 400pc. This is a huge burden to future expansion and growth prospects, these debt loads have to be eradicated and non-performing loans written off, not growing as is presently the case at such a point in this late economic cycle!
The market thinking is that China will rescue Europe from its perilous position, optimists are resurgent on another burst of global growth, sealed by the ‘about-turn’ of the US Federal Reserve rate hikes, which takes us nicely into the examination of USA …….
USA
The US economy received an enormous ‘late-cycle’ economic stimulus package by the policy introduction of the new Trump presidency (Trump signed a $1.5 trillion tax cut that decreased the top corporate tax rate), driving US government borrowing sharply higher ($1.3 Trillion debt increase alone in 2018). Increasing government debt sharply in a so-called economic expansion, what happens to this debt trajectory in a recession? Rocket ship to the moon springs to mind.
The US current economic expansion began in June 2009, and America’s expansion, if it lasts until July 2019, will reach 121 months, the longest ever recorded in over 100 year’s worth of data. All economic expansions come to an end, and historically speaking these lengthy expansions have ended in a crisis.
USA shocked the market with 1st quarter 2019 Gross domestic product (GDP) that expanded at a +3.2 per cent annualized rate in the January-March 2019 that topped all forecasts calling for just 2.3 per cent growth. This in fact was driven by several extraordinary facts when considering both production ( -0.3% ) and imports ( -3.7% ) fell in the first three months of the year, according to government data.
Also spending on consumer durable goods fell -5.3%, the biggest drop recorded in 10 years. This apparent miraculous GDP growth was down solely to $32 billion of goods being added to inventories this last quarter. Building inventories is hardly economically positive especially considering this late economic cycle build and the negative supporting data surrounding it.
Another shocking and negative statistic is US corporate debt reaching another historical all time high when measured against US GDP. As the Fed itself has recently emphasised, corporate debt in the US has risen to very high levels during this expansion, especially in already highly leveraged companies.
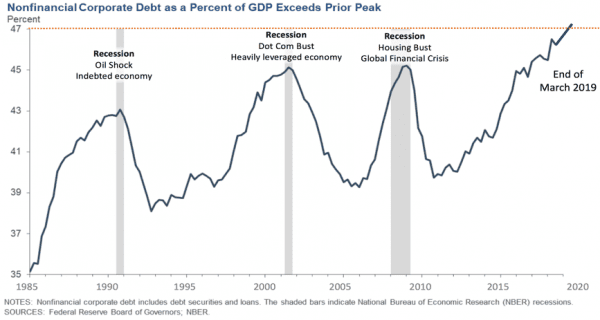

Has this enormous debt growth been used for infrastructure and productivity build? I am afraid to say that predominately this debt has been used solely for corporate stock buybacks and announced buybacks for just year 2018 is now over $1.1 trillion alone.
This has been one of the main drivers of the stock market rally built on a foundation of massive debt growth.
The current size of the BBB-grade (near junk) corporate bond market is now at the highest level that have ever been recorded. The total value of BBB-gate corporate debt is five times what it was just one decade ago.
Conclusion
Citigroup the banking behemoth advised clients two weeks ago to wind down exposure to risky assets and prepare for a storm. After running through the 24 hour clock “We are only 15 minutes to midnight,” it said when referring to the economic cycle and the eventual downturn.
Meanwhile global sovereign central banks have been accumulating an unprecedented amount of physical gold to re-weight their balance sheets, in fact year 2018 was the largest official buying of gold since year 1967. Then as of end of March 2019 the BIS have made gold a tier one asset class for bank balance sheets, directly competing with currencies.
Why are they doing this ?
Central Bank Demand:
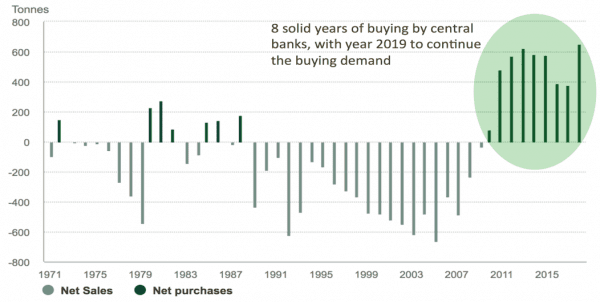

Sources: Metal Focus, Refinitiv GFMS, World Gold Council.
We are clearly at the end of an extremely long economic cycle which has been built on the foundations of debt-saturation, extended balance sheet leverage, supported by abnormally low global interest rates (so as to support the growing global debt bubble). The facts speak for themselves and are indisputable.
As the next downturn gains traction the global policy makers and central bankers will resort to ever more elaborate and fanciful policy reactions, but interest rates are already close to zero, government and central bank balance sheets are already saturated with debt, in a recession government debt explodes higher. Corporates have built the largest mountain of debt ever recorded. Housing markets will be directly affected negatively due to interest rate rises, which are forced upon the market in a global debt bubble bursting.
The world has no choice but to devalue the debt by devaluing the currencies that the debt is denominated in.
Simply put, the demand for wealth preservation assets will overwhelm the system in the months and years ahead, hence the present global demand for gold by wealth managers and sovereign central bankers.
Timing the cycles precisely is fraught with danger, but acknowledging that cycles do exist and a realisation at this particular point in history that our markets and economy are built on a global debt bubble of unprecedented magnitude, the outcome seems rather obvious while the sands of time are running very quickly through the hour glass.
Being as close to the end of this cycle as we are it really does makes you wonder why everyone is looking to go full in on ‘risk-on’ assets such as the stock market and are not already seriously considering diversification to protect their wealth and holdings?
As the global bankers already are, very clearly!
Also a couple of videos analyzing the cycles for you to watch…..
Tavi Costa, global macro analyst at Crescat Capital, makes his Real Vision debut in style — with a bullish trade idea on precious metals. He highlights why it’s …
By David Mitchell