

Price Falls In Metals – Something To Be Worried About?
We have had large moves lower in the metals towards week ending 8th January (to be noted after large price rallies from December which we advised as buy levels at the time) and the emotions of gnashing teeth and jittery nerves has come to the fore.
So, what do we make of this and should our clients be worried? Occasionally, one must go back to the very basics and understand what are the original drivers behind metal pricing and then consult with the technical charts to comprehend the full picture (silver chart update below).
At the turn of the Year into 2021, quite a number of analysts have become very vocal…
ABN Amro have recently clarified that their expectations are for metals to continue to strongly rally in price over the next 2 years with Platinum out-performing Gold, Silver and Palladium. Read Here.
CPM Group have put out advice that they expect Silver to continue to appreciate in price by over 32% per annum over the next few years, Platinum will outperform Silver and of course Gold will continue to appreciate but Silver will clearly out-perform Gold. Watch Here.
Saxo Bank extremely bullish silver, Goldman Sachs, Citibank, Bank of America amongst many other financial institutions and analysts are writing and talking directly about the “New Global Green Deal” and the new “Commodity Super-Cycle” in which a massive fiscal-lead infrastructure build-out takes place in conjunction with significant and dynamic technological advancements around energy; including hydrogen, electrification and a modern approach complete with zero carbon targets.
If nothing else, this is enormously positive for precious metals and Gold, given the highlighted increase in government spending. Cost-push inflation is therefore unavoidable.
In the short term, USA economic reflation bets since the recent Georgia Democrat election win, have already pushed yields on 10-year Treasuries above 1%, while pushing metals lower on profit taking ‘only’!
USA Democrat Wins – What Does This Mean?
President elect Biden but more importantly the Democrats, effectively take majority control over the three distinct branches of federal government: legislative, executive and judicial, whose powers are vested by the U.S. Constitution in the Congress, the President, and the Federal courts respectively.
The political results sufficiently guarantees what we have been writing about for a very long time now and cements the latest stages and developments of our macroeconomic cycle forecasts.
New US politics almost guarantees a V-shaped economic GDP recovery.
Fiscal stimulus will meet the monetary jet fuel already pumped into the system over the last 12 months especially, just as the world starts to recover from the Covid pandemic.
Tax rises will ‘not be’ front loaded over the next 12 to 18 months as the risks of derailing the economy are considered too high; hence much larger fiscal deficits and currency value debasement coupled with high cost-push inflation will be the repercussions which we can all look forward too.
Spending spigots are going to be opened to the very fullest. Biden now has the majority for instant and seismic pandemic economic stimulus. Analysts estimate that the US$900 billion package already approved will be rapidly expanded to US$1.5 trillion, with a rescue package for near-insolvent states and local authorities.
There will also be a US$2,000 cheque for every American; which was the price that Biden had to pay to throw the Republicans off balance in Georgia.
There is a great deal of support from both sides of the House for a green-tech spree, so long as it is seen as stealing a march on China, the spearhead of technological supremacy in the mid-21st century. Both parties support a rise in borrowing, with negative real interest rates and a formidable rebuild of the country’s crumbling infrastructure.
When you crunch all of the numbers, you come up with a very big fiscal expansion. Morgan Stanley expects US$1 trillion of net stimulus, starting with the “easy wins” that everybody can agree on. This is going to collide with the very large expansion of the monetary stock !
The M2 money stock has jumped +25% over the last year. Nothing like this has been seen since the big inflation of the 1970s. What happens if the velocity of money circulation suddenly turns and returns to a more normal basis?
Americans accumulated an extra US$1.5 trillion in their bank accounts during the pandemic. There is a wall of accumulated middle-class money waiting to burst forth like a damn breaking under the sheer force of water pressure.
The consensus is that inflation is going to accelerate sharply into the middle of the year, alongside state support to deal with the crippling after-effects of small businesses going under; which will lend itself to a direct push towards stagflation.
This will NOT be bullish stocks nor property due to the largest debt and leverage bubble in recorded history, but it is particularly bullish for the commodity sectors.
Owners of wealth have done extremely well benefiting from zero rates and QE, however the trickledown to the main-street theory has failed miserably. It has been meagre at most. The switch to government fiscal deficit policy means that more money will now go into the veins of the real economy, and less into the overvalued and speculative asset price bubbles.
It is also a formula for a stronger US$ currency. The US has suffered less ‘economic’ damage than Europe from Covid-19. It’s vaccine roll-out is faster and further ahead. There is every chance that the US will come out of the pandemic like a monetary fuelled rocketship from Q2 2021 onwards.
There is zero chance that the eurozone will do the same. It will be held back by net fiscal contraction because the Recovery Fund is just too small to offset national debt trajectories and debt-servicing requirements and rollovers.
Silver Price Technical Picture Update
The reason for the dynamic price outlook in Silver is the extremely bullish technical picture, which, using my technical picture on the next page clearly points to 40 US$ as a May target (Folks, I do not have a crystal ball or a time machine, this is a technical target, also based on hard core macro numbers)….
As a gentle reminder … Pennants are really short-term triangles. They form with lower highs and higher lows. The line through the peaks and the line through the troughs converge and the pattern is completed by a break outside of the converging lines.
Flags and pennants are congestion patterns that form in overall trends. They represent pauses while a trend consolidates and gathers energy. They are reliable continuation signals of a strong trend pattern.
Silver Chart versus US$ as of 11th January
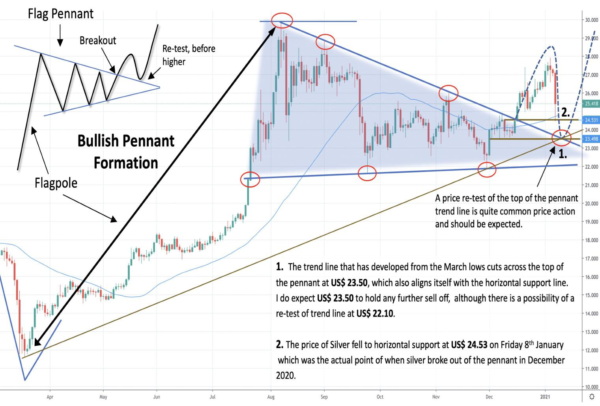
While a re-test of the pennant after a breakout is not desirable or was expected (2.), it is reasonably common in larger trend move developments, happens around 30% of the time.
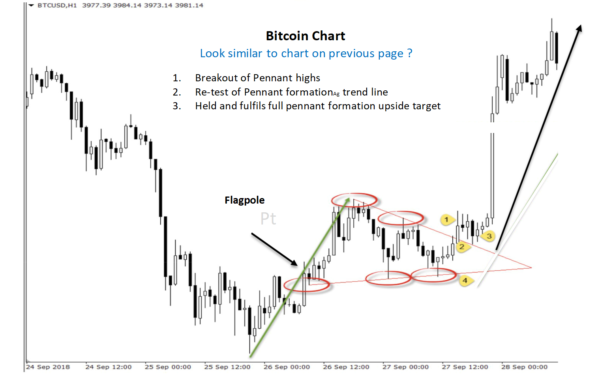
Now if you think this is not normal or bullish , a little look at Bitcoin, please have a look below.
This article is written as a simple guide for our client base of metals investors and should serve only as an opinion piece. It does not take into account the particular circumstances, investment objectives and needs of any individual investor, or purport to be comprehensive or constitute investment advice and should not therefore be relied upon as such.
Disclaimer:
The information contained in our website and this report should be used as general information only. It does not take into account the particular circumstances, investment objectives and needs for investment of any investor, or purport to be comprehensive or constitute investment advice and should not be relied upon as such. You should consult a financial adviser to help you form your own opinion of the information, and on whether the information is suitable for your individual needs and aims as an investor. You should consult appropriate professional advisers on any legal, taxation and accounting implications before making an investment.