Platinum – Exciting Investment Returns Potential in 5 pictures

Posted on 12 Jun, 2020 in
Investors across the world are moving into precious metals to protect themselves against the currency and monetary system debasement that is taking place globally, but what are the metals that hold the most exciting investment return potential?
We strongly believe platinum holds an enormous opportunity for an outsized revaluation return based on many different factors coming together over the immediate horizon.
In this article I will raise some important price, ratio and supply charts that demonstrate how incredibly undervalued platinum is as of today; for the new and existing investors. We are very excited looking out over the next few years of what platinum is going to achieve. I will post the links at the end of this article to the research pieces and news recently posted, that go into greater detail of just some of our internal investment research.
This follows on from what we have achieved for our clients since the beginning of 2016, through precious metals research, portfolio advice and then the procurement on their behalf, re-balancing once targets are achieved.
Year 2016 was the major cycle turning point in precious metals. Rhodium up + 1,500%, Palladium +520%, and now we are targeting the next metals that hold the most potential.
Platinum usages, it really does have diverse drivers of demand…
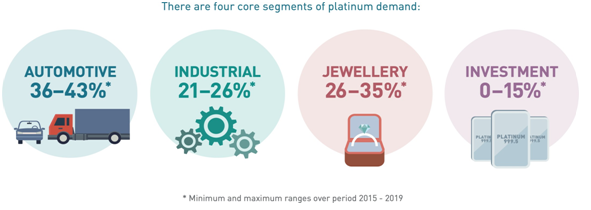
Platinum is incredibly rare; in fact it is 15 times rarer than gold. This dense, chemically-stable, grey-white metal has an occurrence of only 0.005 parts per million in the earth’s crust. Its name is derived from the Spanish term ’platino’, meaning “little silver”.
It was first discovered and mentioned around 1557, and again in the mid 1700’s as platinum had been used by various pre-Columbian South American civilizations. However it remained widely ignored and unappreciated for centuries due to its extremely high melting point (1,768.3° C or 3,214.9° F), which made it very difficult to fabricate in earlier times; but extremely important today due to that very fact of its very high melt point and platinum metal alloys are harder, stronger and more corrosion resistant than individual metals.
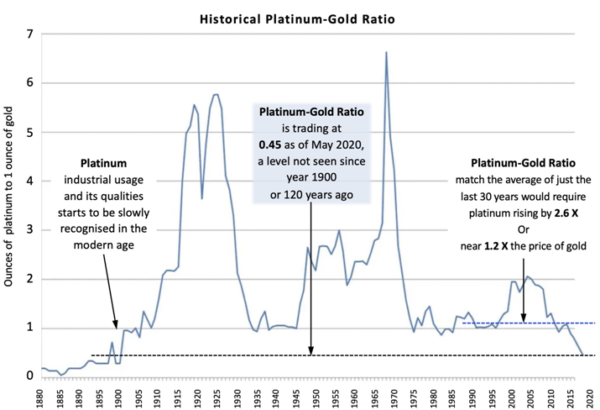
This started to change in the early 1900’s. See below the platinum-gold ratio, the amount of ounces of platinum to 1 ounce of gold.
Platinum is presently trading at a price level versus gold that clearly indicates incredible undervaluation, in fact the cheapest level versus gold in 120 years – what an opportunity ?
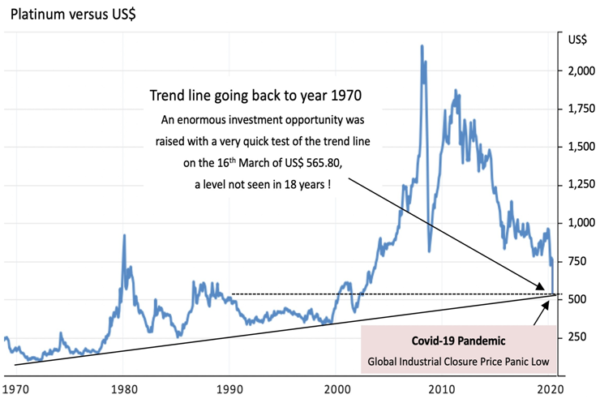
Also another clear indication of platinum present undervaluation can be seen in its chart versus the US$.
This chart is a very long-term chart going back to 1969, in fact over 70 years. It clearly demonstrates a number of important price factors
- Platinum retested a trend line support going back to 1970, presently Pt is trading around US$750
- Platinum re-tested a price level last seen 18 years ago, taking into consideration the vast currency value debasement and platinum’s extreme cost of production and its rarity seems somewhat of an enormous opportunity ?
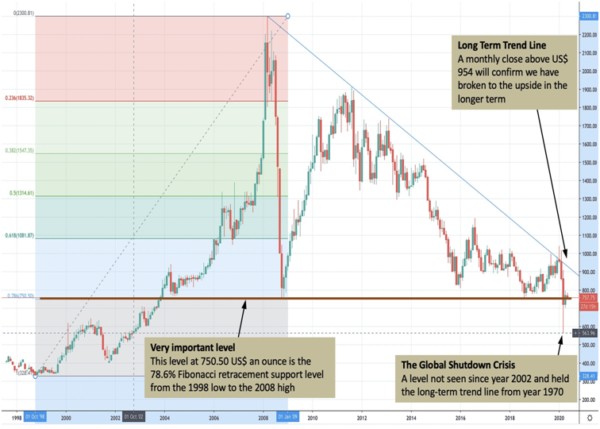
Another Platinum price chart in US$ going back to year 1998, the coloured areas to the left demonstrate Fibonacci retracement levels.
Fibonacci retracement levels are horizontal lines that indicate where support and resistance are likely to occur.
They are based on Fibonacci numbers and each level is associated with a percentage. This percentage is how much of a prior move the price has retraced – in this example the low in 1998 to the high of year 2008.
- The main points to be made here are the Fibonacci retracement of 78.6% from the high arrives at US$750.50 which historically speaking looking across multiple charts is an important investment buying opportunity, the breakdown recently below this level is seen as a false break due to the global shut-down. This chart is also seen as a bullish support conclusion of a multi-year ‘bear’ market lasting over 12-years
More importantly, we have to study ‘supply-demand’ curves in the industrial picture. Now the chart below is from the CPM Group. The surpluses since 2008 have confirmed the price falls in platinum since 2008 into today.
The main points to be made are….
- CPM are forecasting a surplus supply picture over the next 18 months or so, based on the expected global recession / depression we are now in (surpluses was not forecast before the global shutdown) and hence less industrial demand. However over 72% of global platinum productions comes from South Africa that is presently experiencing serious energy infrastructure shortages and hence we believe through more in-depth research that production will be heavily tempered/reduced.
- These forecasts are not based on investment demand which can change the ‘supply-demand’ picture quickly into deficit.
- These forecasts are based on “Base Case Scenario”, the true picture looks more alarming with regards to future ‘supply-demand’ deficits
- They are recognising a new long-term “deficit” trend developing, forecast to get steadily worse well into the early years of the next decade of growing substantial supply shortages.
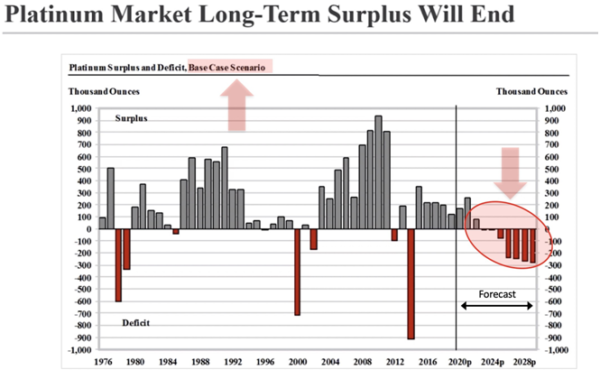
Source : CPM Group
It must also be noted that it is estimated there is only 3.2 million ounce of platinum available as above ground stocks, or 39% of year 2019 demand.
If you wish to study further, then some in-depth research of platinum was made available. Check out the articles and click the links below….