
Let us look at the gold price action and hopefully garner a clearer picture of where we are at, do we expect that metals hold an exciting prospect for new investment at these levels even after the large moves higher over the last few months?
Let us just concentrate on the price action and if one should still be buying today, levels to watch for, seasonality of gold prices and ultimately the bigger price picture moving forward.
I will also concentrate on the metals measured in US$, which is somewhat one-dimensional considering gold is trading at all time highs in over 73 global currencies including Australian Dollars (Aud), UK Sterling (Gbp), Japan (Yen), Canada (Cad), Indian Rupees (INR) etc..
Given the obvious potential for further turmoil in the currency markets in the coming weeks, months and years ahead, the moves in precious metals against global currencies that are weakening, or currencies not considered safe-havens on the world stage will continue to appreciate, as demand for gold and silver by holders of those currencies to protect themselves.
Gold Price Chart Technical
Looking at the longer-term chart going back to year 2010, there are some clear levels and indicators that gives us a more defined picture.
- Gold has exceeded its 50% Fibonacci retracement level measured from the all time high of September 2011 down to the lows of December 2015, this would be very healthy if we can close in August above US$ 1,484, however technically speaking the 61.8% retracement is the next immediate target which is US$ 1,587.40 – I believe this level of US$ 1,587 will hold in the shorter term
- RSI (Relative strength Index) is a momentum oscillator that measures the speed and change of price movements. Its clearly at all time highs last seen in December 2010. However that did not stop the rally into late 2011, or in April 2016. What this is suggesting is that the price could tread water between a range over next few months (lowering the RSI) before it moves to greater highs into 2020 and onwards (see page 4).
- Very strong support lies in the horizontal at the 0.382% Fib support which can be clearly seen – excellent buy levels from here.

Gold Monthly Seasonality
Timing your purchase is extremely important, we have dealt with disgruntled clients as they have approached us with existing holdings heavily discouraged by their holdings performance simply because they timed their investment badly.
Our job is not only to lay out the bigger picture for our clients, but to also help them time their investment purchases.
It is always advisable to look across all historical data points to empirically qualify timing objectives.
Let us look at the historical price data going back to 1975 examining the average gains and losses within the calendar year and identity if there are monthly trends. The results are surprising…
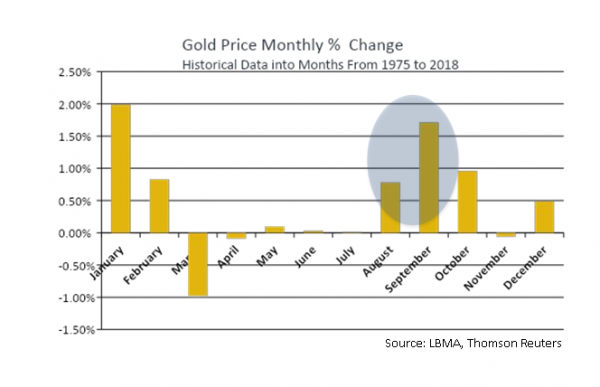
You can see that on average, gold tends to turn strongly higher during the first couple of months of the year. The price then moves sideways down through the spring into the summer, then August starts to move higher into the autumn, then either falls back slightly or moves sideways into December.
- This means that on a historical basis, the best times to buy are the beginning of January, early April, or early July.
- The best months for price appreciation are January and September.
Longer-Term Gold Outlook
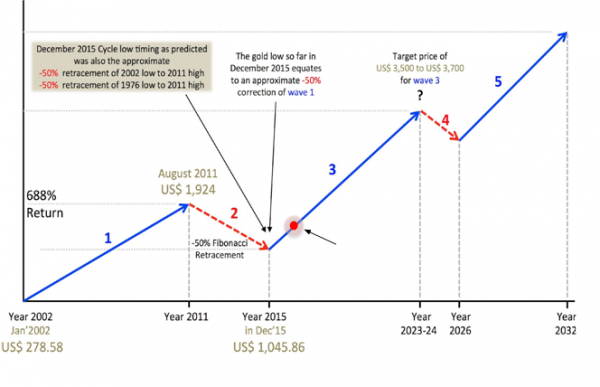
I first published the cycles and timing just after the 2011 highs and re-printed in our “Gold E-Book” in 2017 see link here, I realised that the Pi cycles were actually lining up with ‘Elliot Wave Theory’ structure and when explaining to clients the overall picture, this was a much easier way to illustrate from their perspective.
Editor Note: Information contained herein is solely the opinion of the publisher and hence its accuracy cannot be guaranteed, as it’s solely a forecast. It is not designed to meet your personal situation – we are not financial advisors.
Under Elliot wave the rules that apply ….
- Wave 1 (impulse wave)
- Wave 2 is typically 50%, 61.8%, 76.4%, or 85.4% of wave 1 (corrective wave)
- Wave 3 is typically 161.8% of wave 1 (impulse wave)
- Wave 4 is typically 14.6%, 23.6%, or 38.2% of wave 3 (corrective wave)
- Wave 5 is typically 61.8%, 100%, or 123.6% of wave 1 (impulse wave)
Guideline 1: When Wave 3 is the longest impulse wave in price (which cycle wise is very much predicted as far as price is concerned), Wave 5 will approximately equal Wave 1 in size.
Guideline 2: The forms for Wave 2 and Wave 4 will alternate. If Wave 2 is a sharp correction (which in this case it most definitely has been), Wave 4 will be a flat correction (i.e. only a -14.6% ?). If Wave 2 is flat (was not), Wave 4 will be sharp.
Gold Price Conclusion
Gold is very much within its next phase of its major secular bull market. The cycle lows were predicted and have proven to be correct as of December 2015 / January 2016, since then gold in US$ alone has climbed by +46%, although in other world currencies the moves have been dramatically more extreme (see table).
As I have demonstrated in the technical picture we are due probably sideways price action in a wide range of US$1,587 down to US$1,380 (as the most likely levels to watch for) due the overbought nature of the price action over the next 3 months or so.
However clients should always measure gold in their own currency and not focus whatsoever on what the metals are doing in US$, for example in UK Sterling gold is up over +30% in just 12 months, in Aussie +37% in the last 12 months.

Longer term the precious metals are heading for much higher revaluations and is very clear from the cycles and wave structure.
Future and continued currency value destruction is without doubt at this stage, so clients should understand that we are only 15 to 20% through this next wave higher in the gold price, according to our analysis.
Editor Note: This article is not designed to give you short term trading advice, its solely designed to give our clients the opportunity to recognise where we are presently and what opportunities exist in buying metals and the levels to be aware of .