
Silver Price & Price Conclusion
We now arrive at a really exciting investment trade versus gold. There are other precious metal opportunities compared to silver which are equally as exciting, which I will cover in new reports moving forward.
The macro fundamentals and technical picture for silver here is nothing short of spectacular in our analysis. Silver is gold on steroids, whether it is in a bear market (silver will fall much harder) or bull market, silver will out-perform gold not just in percentage terms but in multiples of price.
This silver long term chart below is extremely bullish, the multi-year accumulation at the significant Fibonacci retracement of 0.786% from the lows in 1993 to the 2011 highs which is at US$ 13.50 approximately. In this article I have gone back to these retracements (simply because in analysing the longer term cycles when looking for extremely important supports and resistance points) they are actually incredibly important.
Silver has proven itself yet again, when in a bear market the investment community literally throws the ‘baby out with the bath water’ and the capitulation has been nothing short of stunning, with no real understanding of the growing bullish macro fundamentals for silver, see link here.
As ‘Rick Rule’ (of Sprott Asset Management) has stated on many occasions “the cure for low prices is lower prices!”. What he means by this is lower prices will drive out the weak unprofitable producers (shrink supply) and new exploration and fresh supply will be deemed uneconomical due to the low prices. Also global stock piles of the metal will be utilised into production purposes. This fact has been supported by the CPM Group analysis that stock piles of investment bars of silver globally is lower today that it was in the 1970’s (bull market) and also the first decade between years 2002 to 2011 (second great bull market). When the prices rise the strong hands holding onto the investment grade silver will not wish to sell, further aggravating supply/demand deficits invigorating a new bull market in silver.
These facts are supported again by a decline in global mine production numbers the last few years including this year as recorded in the first 2 quarters.
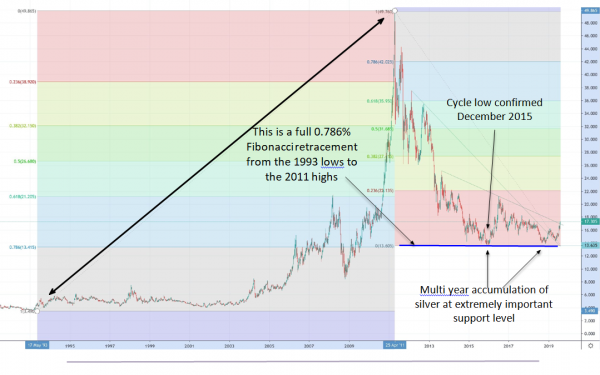
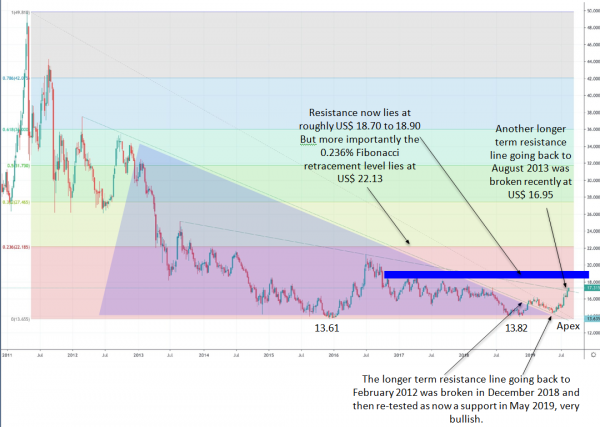
This silver chart going back to the 2011 highs demonstrates that multi year accumulation has taken place at an extremely important support retracement in the US$ 13.60 to 13.80 level since December 2014.
More importantly, you can see a descending triangle that has formed. In the realm of technical analysis we normally think of the descending triangle pattern as being a bearish pattern, however technical analysis isn’t necessarily about the pattern itself, it’s about the psychology of what’s going on within the pattern. When bearish patterns fail -and I would suggest this clearly has failed to the downside, they can produce extremely quick and very powerful moves higher. This also has overextended itself right down to the apex of the triangle, have the shorts exhausted themselves?
Now lets have a look at another extremely important chart the ‘Gold – Silver Ratio’ for further analysis of silver as an extremely important investment opportunity at this time.
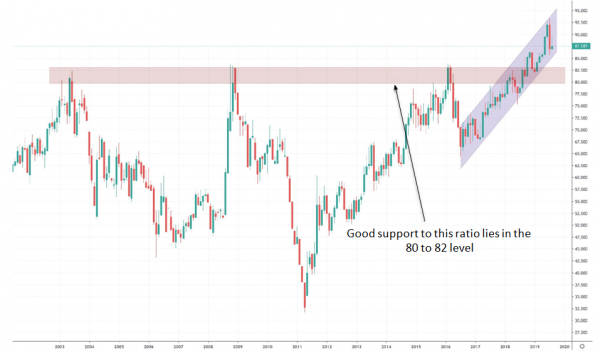
This chart below is the ratio of how many ounces of silver you would get for 1 ounce of gold. Presently we are trading at all time historical high, only seen twice before in all of historical records going back to 3,200 year BC (yes we do have records going that far back), why on earth is this important ?
Well actually the ratio of silver to gold in the earth’s crust is measured at 17.5 to 1, while actual mine production as of 2018 is running at approximately 8 to 1, and today’s price is trading at 88 to 1.
With gold trading sharply higher since the cycle lows of December 2015, silver has simply languished near the trading lows, which has driven the Gold Silver Ratio to trade at 93.4 to 1 in July of this year. You can clearly see in this very bullish highlighted trading channel that it again traded at the upper resistance line. In 2011 the GSR traded at 31 to 1

Analysing price chart data in addition to what is ultimately happening in the gold price and the fact we are about to enter a ‘super bull market’ in silver gives a very strong result using our price wave structure. This is targeting a conservative figure of 35 to 1 in the GSR (gold silver ratio) but could well overshoot down to 25 to 1. Putting all this together we have a target price of 100 to 135 US$ per ounce in silver from today’s level of US$ 17.30.
A price rise of near 800% may seem somewhat outlandish, but our investment in silver in 2004 achieved gains of over 800% by 2011, an Armstrong Pi cycle of 8.6 years time frame from the lows of Year 2002 to the peak of 2011.
Today that same cycle time frame measures in at year 2024 (from December 2015 cycle lows) which lines up nicely with the wave structure on the gold target into year 2024.
Disclaimer:
The information contained in our website should be used as general information only. It does not take into account the particular circumstances, investment objectives and needs for investment of any investor, or purport to be comprehensive or constitute investment advice and should not be relied upon as such. You should consult a financial adviser to help you form your own opinion of the information, and on whether the information is suitable for your individual needs and aims as an investor. You should consult appropriate professional advisers on any legal, taxation and accounting implications before making an investment.